
A Quarter Review
The S&P 500 increased 10.94% during the second quarter following the April 9th announcement of a 90-day pause on U.S. reciprocal tariffs. This marked a turning point for markets, leading the S&P 500 to rally approximately 25% from its April 8th low. As a result, the worst underperformers of the first quarter – expensive mega cap growth and AI-exposed stocks – outperformed meaningfully in the second quarter.
The top performing sectors were Information Technology (23.7%), Communication Services (18.5%), and Industrials (12.9%). The worst performing sectors were Energy (-8.6%), Health Care (-7.2%), and Real Estate (-0.4%).
Performance Summary
The Johnson Equity Income Composite posted a return of 2.96%, net of fees, underperforming the aforementioned 10.94% return of the S&P 500 in the second quarter. This followed strong relative performance in the first quarter, when the Composite returned +1.0% compared to the S&P 500’s -4.27% return. As a result of the shift in the market compared to earlier in the year, both sector allocation and stock selection were a drag on relative performance in the quarter. The Composite was notably underweight in Communication Services and Technology, two sectors that significantly outperformed the broader index year-to-date and especially surged after the tariff pause announcement. Our overweight in Health Care and cash also detracted from relative performance during this period. As a partial offset, we benefited from an overweight position in Industrials, which has emerged as the top-performing sector year-to-date, and from an underweight position in Real Estate, which had negative returns during the quarter.
With the rebound of the largest stocks in the index, the S&P 500 remains extraordinarily concentrated. As such, given our more diversified portfolio construction discipline, our relative returns continue to be impacted significantly by structural underweights to the largest names in the index. NVIDIA and Broadcom, which we did not own, represented meaningful detractors. In contrast, Apple and Berkshire Hathaway were among the top positive contributors to relative performance as both stocks posted negative returns year-to-date. Other notable positive contributors included nVent, Amphenol, and Taiwan Semiconductor, all of which benefited from the previously mentioned rebound in AI-exposed stocks during the quarter.
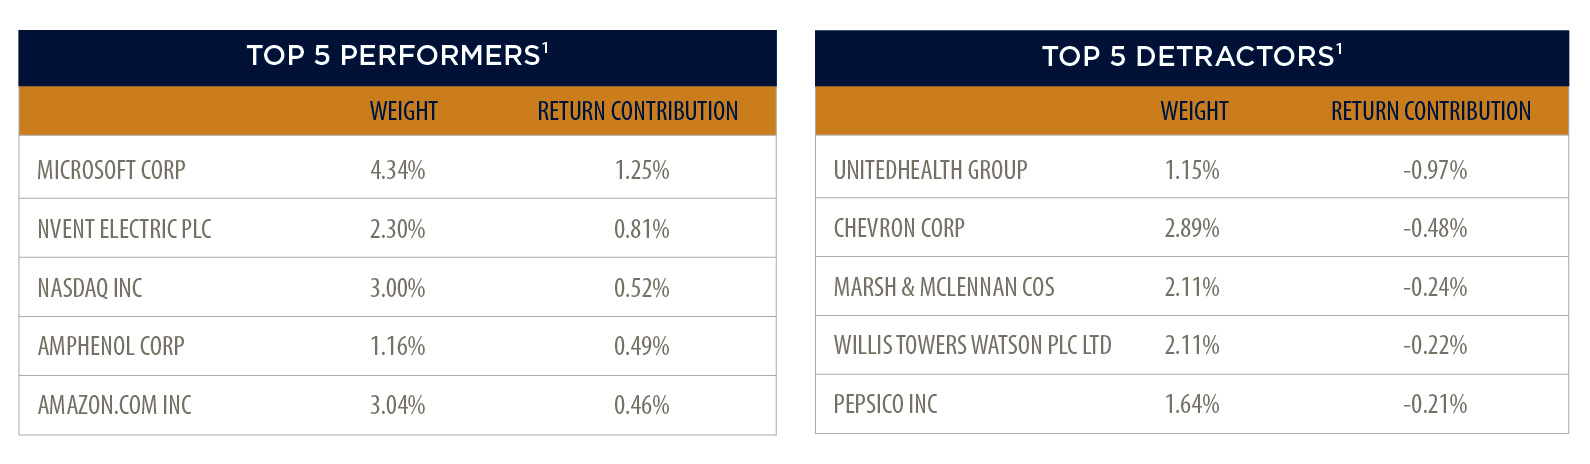
1) Past performance is not indicative of future results, and there is a risk of loss of all or part of your investment. The above does not represent all holdings in the Strategy. Holdings listed might not have been held for the full period. To obtain a copy of Johnson Asset Management’s calculation methodology and a list of all holdings with contribution analysis, please contact your service team. The data provided is supplemental. Please see important disclosures at the end of this document.
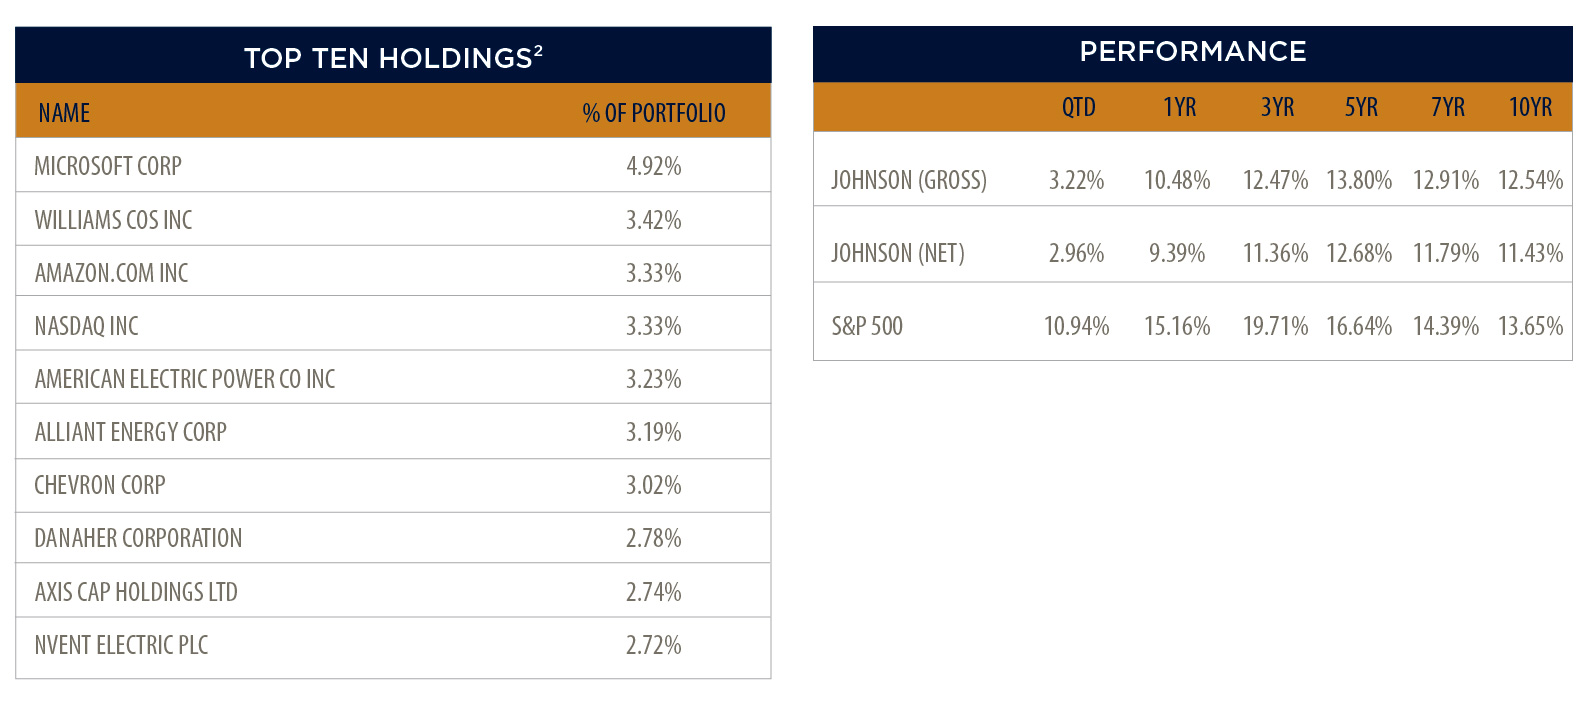
2) Holdings are subject to change. Past performance is not indicative of future results, and there is risk of loss of all or part of your investment. The data provided is supplemental. Please see disclosures at the end of this document.
Market Outlook and Portfolio Positioning
Current market pricing reflects a very low perceived risk, as P/E multiples are nearing highs, credit spreads have tightened significantly, and the VIX, a measure of market volatility, has returned to calm levels. Simply put, investors are currently receiving limited compensation for taking on risk. Meanwhile, the tariff issue remains unresolved, now delayed to August 1, leaving future impacts uncertain. Looking ahead, we’ll continue to closely monitor market developments and make strategic adjustments to align with our long-term objectives. Those objectives are a focus on capital protection and preservation, as well as enhancing the spending power of capital over time. We view the combination of a consistent valuation discipline and quality focus as the best means to reach those aims, regardless of the prevailing market environment.
The Johnson Equity Income Strategy seeks to outperform the S&P 500 over a full market cycle with a disciplined quality framework that provides investors with long-term capital growth, above-average shareholder yield, and reduced volatility through downside protection. For more information on our products and services, please contact a member of our Sales & Client Service Team at 513.389.2770 or info@johnsonasset.com.
Published 07/22/2025
Johnson Asset Management (JAM) is a division of Johnson Investment Counsel, Inc. (“JIC”), an independent and privately owned Midwestern based investment advisory firm registered with the Securities and Exchange Commission. Johnson Asset Management manages institutional separate account portfolios for a wide variety of for-profit and non-profit organizations, public agencies, public and private retirement plans, and personal trusts of all sizes. It may also serve as sub-adviser for mutual funds. JIC’s fees are available upon request and may be found in our Form ADV Part 2A. Performance data quoted herein represents past performance. Past performance does not guarantee or indicate future results. All data is current as of June 30, 2025 unless otherwise noted. Returns and net asset value will fluctuate. To determine if this strategy is appropriate for you, carefully consider the investment objectives, risk factors, and expenses before investing. Individual account management and construction will vary depending on each client's investment needs and objectives. Investments employing JIC’s strategies are NOT insured by the FDIC or by any other Federal Government Agency, are NOT Bank deposits, are NOT guaranteed by any Bank or any Bank affiliate, and MAY lose value, including possible loss of principal. Johnson Investment Counsel claims compliance with the Global Investment Performance Standards. The Equity Income composite includes all fee paying, fully discretionary, actively managed equity portfolios with a minimum value of $500,000 and an investment objective of Equity Income, benchmarked against the S&P 500 Index. The S&P 500 Index is a broad-based flagship benchmark that measures the performance of the largest companies listed on US stock exchanges. JIC’s policies for valuing portfolios, calculating performance and preparing compliant presentations, as well as a complete list of composite descriptions are available upon request. GIPS® is a registered trademark of CFA Institute. CFA Institute does not endorse or promote this organization, nor does it warrant the accuracy or quality of the content contained herein. Please contact our office at 513.389.2770 or 3777 West Fork Road, Cincinnati, OH 45247. All returns reflect the reinvestment of investment income (dividends and/or interest) and capital gains. Valuations and returns are stated in U.S. dollars. Trade date accounting is used. Portfolio returns are calculated using time weighed return methodology on a monthly basis. Net returns shown reflect gross performance less the highest fee schedule for this strategy. Actual client returns would also be reduced by brokerage commissions, custodial fees, and other client paid expenses detailed in JIC’s Form ADV Part 2A.