A Quarter Review
While second-quarter market moves appear modest on the surface—10-year Treasury yields rose just 2 basis points, and investment-grade credit spreads tightened by 11 basis points—the intra-quarter volatility was anything but. The Liberation Day tariffs in early April shocked markets, driving a sharp equity selloff that briefly brought the S&P 500 near bear market territory. The bond market response was more nuanced: with short-term yields falling on growth concerns and long-end yields rising with inflation fears. Corporate credit also reacted strongly, with spreads widening sharply to just under 120 basis points, the highest level since 2023, before retreating later in the quarter as economic data showed stable growth and slower than expected inflation.
Performance Summary
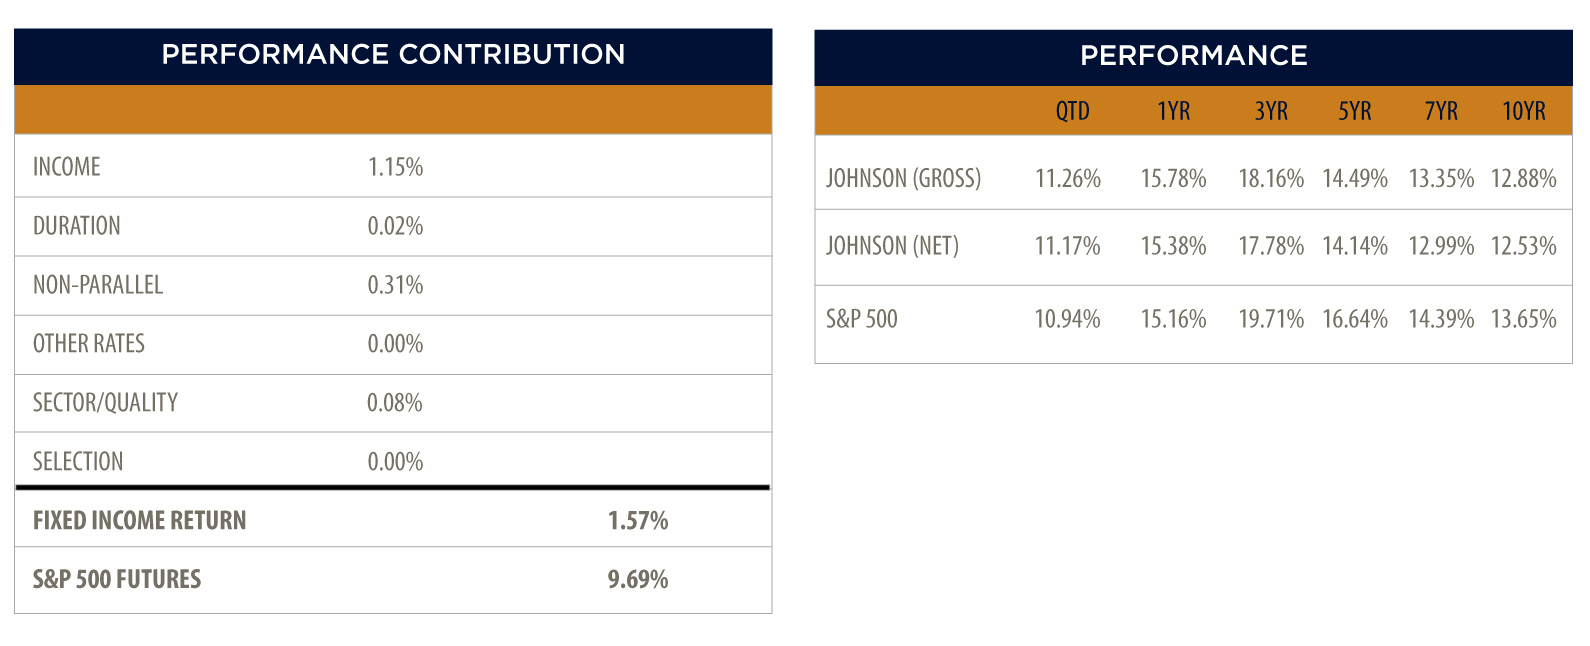
The Johnson Enhanced Index Strategy returned 11.17% net of fees during the first quarter, outperforming the S&P 500 Index, which closed the quarter up 10.94%. The primary driver of the Strategy’s relative outperformance were returns in the bond portion of the portfolio that exceeded the embedded cost-of-carry within its equity futures contract positions. Cost-of-carry remains somewhat elevated but has moderated since the beginning of the year.
Within the bond portfolio, interest rates fell across the front end of the yield curve which contributed positively to performance. The Strategy’s focus on higher-yielding investment grade corporate bonds was additive to performance and was further enhanced by our tactical addition to credit during April’s market dislocation. While short duration investment-grade spreads tightened 6 basis points over the full quarter, they finished 35 basis points tighter from their April peak. The Strategy’s allocation to mortgage-backed securities was also a modest boost to performance as short duration MBS posted positive excess returns during the quarter.
Market Outlook and Portfolio Positioning
Looking ahead, the Strategy remains positioned for a balanced environment. While credit valuations have been compressed, the likelihood of a tariff-driven recession has diminished. As a result, we continue to maintain the additional credit exposure initiated in April. Interest rates remain rangebound but elevated by historical standards. Government bond weight is focused on the front end and belly of the yield curve, which should perform well if the Fed resumes its downward trajectory on the Fed Funds policy rate. Although trade policy briefly receded from the headlines, it remains a key risk factor that could re-emerge in the second half. As always, we remain committed to preserving capital, providing consistent income, and maintaining stability, especially in periods of heightened uncertainty.
Our primary objective is to outperform the S&P 500 Index with low tracking error and comparable volatility by replicating the Large Cap Equity market using Index Futures, combined with short duration investment grade Fixed Income securities. For more information on our products and services, please contact a member of our Sales & Client Service Team at 513.389.2770 or info@johnsonasset.com.
Published 07/22/2025
Johnson Asset Management (JAM) is a division of Johnson Investment Counsel, Inc. (“JIC”), an independent and privately owned Midwestern based investment advisory firm registered with the Securities and Exchange Commission. Johnson Asset Management manages institutional separate account portfolios for a wide variety of for-profit and nonprofit organizations, public agencies, public and private retirement plans, and personal trusts of all sizes. It may also serve as sub-adviser for mutual funds. JIC’s fees are available upon request and may be found in our Form ADV Part 2A. Performance data quoted herein represents past performance. Past performance does not guarantee or indicate future results. All data is current as of June 30, 2025 unless otherwise noted. Returns and net asset value will fluctuate. To determine if this strategy is appropriate for you, carefully consider the investment objectives, risk factors, and expenses before investing. Individual account management and construction will vary depending on each client's investment needs and objectives. Investments employing JIC’s strategies are NOT insured by the FDIC or by any other Federal Government Agency, are NOT Bank deposits, are NOT guaranteed by any Bank or any Bank affiliate, and MAY lose value, including possible loss of principal. Johnson Asset Management claims compliance with the Global Investment Performance Standards (GIPS). A complete list of firm composites and performance results and the policies for valuing portfolios, calculating performance, and preparing GIPS compliant presentations are available upon request by calling 513-389-2770. GIPS® is a registered trademark of CFA Institute. CFA Institute does not endorse or promote this organization, nor does it warrant the accuracy or quality of the content contained herein. Composite: The Johnson SMID Cap Core Equity Composite was created on January 1, 2013, and includes all of JIC’s fee paying, fully discretionary institutional equity portfolios with a minimum of $1,000,000 and an investment objective of small and mid-cap equities. The benchmark for this composite is the Russell 2500, a broadly diversified mid and small cap equity universe of U.S. companies. Eligible new portfolios are included in the composite the first full month after being deemed fully invested. The returns from terminated portfolios are included prior to the date of termination. Effective January 2010, a portfolio will be temporarily removed from this composite if it experiences a net inflow or outflow of cash of 30% or more during a one-month period. Other than the futures contracts that are utilized to replicate the S&P 500, no leverage is used in the Composite portfolios. Portfolios in this composite include cash, cash equivalents, investment securities, interest and dividends. The U.S. dollar is the base currency. All returns reflect the reinvestment of investment income (dividends and/or interest) and capital gains. Valuations and returns are stated in U.S. dollars. Trade date accounting is used. Portfolio returns are calculated using time weighed return methodology on a monthly basis. Net returns shown reflect gross performance less the highest fee schedule for this strategy. The highest investment management fee schedule for this strategy is 1.00%. Actual client returns could also be reduced by brokerage commissions, custodial fees, and other client paid expenses detailed in JIC’s Form ADV Part 2A.